Designing and creating web systems can be *very* hard. I've been developing software using microservices architectures and Node JS for the last years, and from time to time you can get into situations that force you to learn a lot. This is a story about one of those.
One of the things we built in TES is an ETL platform, whose main responsibility is to collect, store and transform data from multiple sources, as well as making this data available to apps and data scientists via different APIs. One of these sources was indeed meaningful events happening in the browser (job applications, page views, document downloads etc). We created a microservice for this purpose, whose name is event tracking. Its main responsibility was to serve as an entry point for browser events, enhance the payload with session information from cookies and immediately store the data in rabbitmq for further consumption. This is where our story developed.
This service had been working fine during the last year or so, and we barely made changes to it once we had built it (that was a good sign). Since we used Datadog, we decided to create standard alerts in all our docker containers in order to report CPU and memory consumption for each service. And soon after that we received a “random” alert warning our event tracking service was utilising its memory levels beyond its initial 1 GB allowance. At first you just think “that’s weird”, and because after a while its memory levels went back to normal, we were convinced that was just a random, odd event that will never ever happen again. Until the next day the same alert came back and we thought…alright.
Assessing the impact
It’s hard to think clearly when you realise you are facing a time bomb (that looked like it would happen again soon!), but the first thing we did was to assess how severe this was, in order to prioritise the issue. If a microservice restarts due to a technical problem but it’s backed up by RabbitMQ or is in charge of a transaction that is rolled back from a database may not be the end of the world. However due to the nature of this service, and even though we had x3 replicas of the same docker container in different servers, this meant we could have lost valuable data had the service become unavailable. We had a real P1 issue. Funny, since this had most likely been happening since the very beginning, but now we just knew about it.
Trying to put out the fire
If your house was set on fire you wouldn’t immediately try to figure out why that happened: you’d just throw buckets of water at it, suffocate the fire and only then start doing your research.
In this case, since we had an obvious memory leak, we tried to increase the memory threshold in the docker container up to 3Gbs, hoping that’d alleviate the still unknown memory leak and offer more information about it.
Of course this didn’t fix it, but it was useful for two reasons:
- Our service would restart later and less often.
- We could clearly observe and correlate the start of the memory leak generation with the start of peak time in TES, where a large amount of events was received.
We decided to keep the memory limits to 3Gbs. Another temporary workaround is to make your service restart before it’s too late. But we obviously needed to investigate further. And so we did.
Following the scientific method
Scientific method is an empirical method of knowledge acquisition involving careful observation, formulating hypotheses, via induction, based on such observations; experimental testing and measurement of deductions drawn from the hypotheses; and refinement (or elimination) of the hypotheses based on the experimental findings.
Hypotheses formulation
As the definition says, we needed to formulate an hypotheses based on careful observation first. Essentially, we needed a thread to pull from. Thanks to our monitoring and the different results after altering the memory threshold in the docker container, we noticed the memory leak always started to manifest during peak hours, so our first hypotheses was “this memory leak manifests during peak time, so our service doesn’t manage memory correctly when it receives a large amount of events”. We didn’t know much more than that at that point. We just needed to prove this theory, understand why it happened and fix it. Easy peasy, right?
Experimental testing
We usually reached peak time at around 12:00 UK time during week days. Obviously we couldn’t test in the live environment, let alone wait for 24 hours until we could try again. That’s why the first thing we focused on was trying to reproduce the environmental conditions locally. If achieved, this would massively facilitate our research.
Luckily it was relatively easy to reproduce the issue by smashing our service locally with thousands of events. Memory in our node process would increase indefinitely. There was hope.
Measurement of deductions
If you don’t have a measure you can’t say whether you’ve fixed the issue or not. In our case memory consumption was easy to check. That’s why we used toolsto snapshot memory levels. This allowed us to discover our memory leak was related to rabbitmq publications.
We used the divide and conquer technique to find where exactly in the code we were having trouble. This is a simplified version of the place where we spotted the issue:
const handler = (message, content, ackOrNack) => {
   broker.publish('eventsAll', event, (err, publication) => {
      if (err) {
        // error handling here
        return;
      }
      publication
      .on('success', () => { // some logging + monitoring })
      .on('error', () => { // some logging + monitoring });
   }

   ackOrNack();
};
As you can see, we were using fire and forget on this handler. We were publishing on rabbitmq (using this amazing library), but we were not waiting for it to finish (ackOrNack is called immediately after).
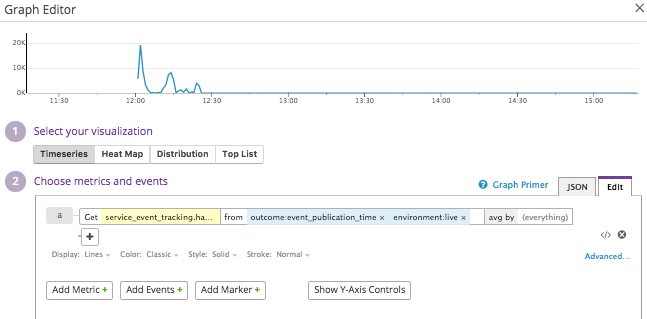
What we observed is: our publication callbacks were taking much more time to resolve once we started firing a huge amount of events. To prove this behaviour we placed some timing on monitoring and got this result:
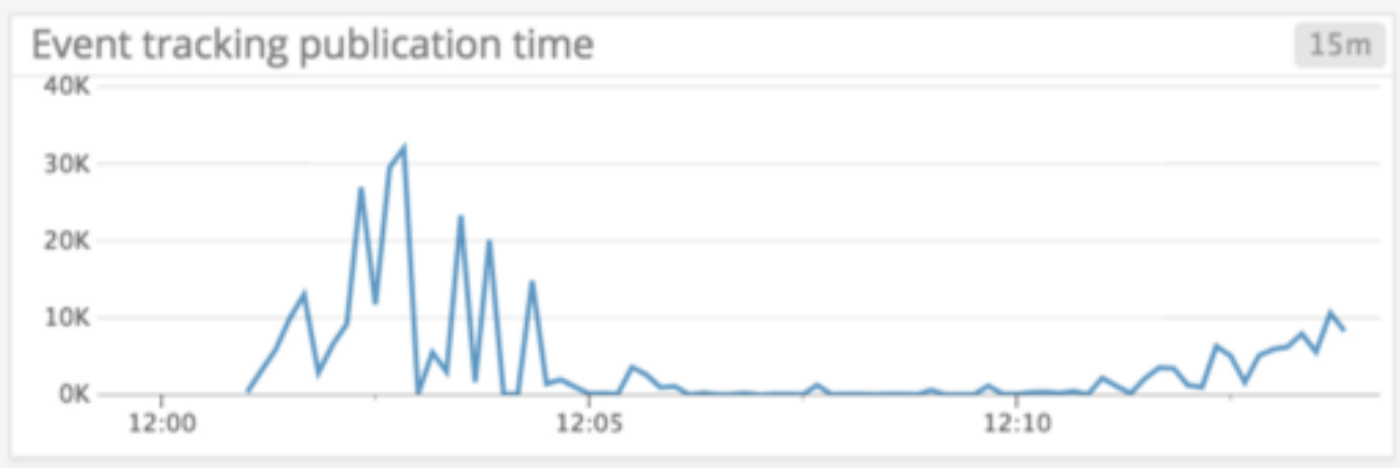
As you can see, the time for the publication callback to resolve was increasing on peak time (when the memory leak is happening)— which essentially suggested there was a bottleneck: we were producing callbacks much faster than resolving them. But we still didn’t know exactly why, so we focused on fixing the publication time, thinking that would lead to fixing the memory leak.
Choose your measures wisely: don’t make things worse
We thought that if we fixed the publication time that would mean the service could keep a healthy pace at processing events, and therefore the memory leak would go away:
const handler = (message, content, ackOrNack) => {
   broker.publish('eventsAll', event, (err, publication) => {
      if (err) {
        // error handling here
        return;
      }
      publication
      .on('success', () => {
          // some logging + monitoring
          ackOrNack();
})
      .on('error', () => {
         // some logging + monitoring
         ackOrNack();
      });
   }
};
We were essentially removing fire and forget. As you can see, the ackOrNack was only called after the publication was completed. This, indeed, improved the publication time and memory consumption in our local environment, so we happily put it in production, thinking the fix had been made.
But soon after we put this in live we started getting 503 from our services. This is bad. Again, following the fire metaphor, we immediately rolled our changes back. We needed to think a bit deeper.
Essentially what was happening was: our changes were backfiring. We removed the bottleneck from rabbitmq, but we placed it somewhere else: in the http servers. All http connections were taking longer to resolve, because now each event request would take longer to process since they were waiting for publication callbacks to finish. This saturated the express server with increasing pending connections, and it wouldn’t allow any other incoming events.
The fix we attempted would work well if we could control the input (like a rabbimq subscription), but not when you have an uncontrolled amount of events coming in. Also, with our services returning 503 the browser wouldn’t retry to send those events, so we were losing data under that situation.
Refinement based on the experimental findings
Experimentation and mistakes gave us a lot of information. We knew the bottleneck was happening because publications were taking too much time to resolve their callbacks under high pressure. We also knew we couldn’t make http clients wait for them.
So the only solution was to make publications faster. In the rascal library we were using there was a collection of commits that made publications channel pools configurable. The default, however, was set to 1 (recommended unless you know what you’re doing). All we had to do is to increase the pool size in our service:
{
  "rascal": {
    "defaults": {
      "vhosts": {
        "publicationChannelPools": {
          "regularPoolSize": 15,
          "confirmPoolSize": 15
        }
      }
    }
  }
}
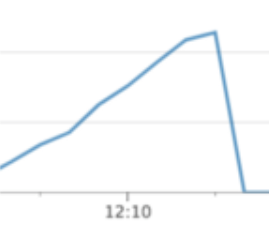
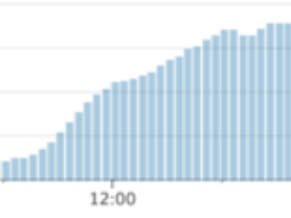
This little amendment in config is all we had to do. Look at the publication time graph before and after we made this change:
The same thing happened with memory consumption, which stayed at very low, sensible levels after our fix was sent to the live environment.
Conclusions
I hope this article can show some of our learnings in the process of chasing a memory leak. This is some of our lessons from this story:
- Monitor your health vitals (memory & CPU at least) by default in all your services: this issue was there all the time, we just didn’t know about it.
- Try to reproduce issues locally if you want to focus all your energy on the fix, rather than chasing ghosts.
- Use tools to debug memory consumption: it’s absolutely key.
- Learn about event loop, how callbacks work and how they could affect your service memory levels.
- Follow the scientific method as framework to do your research, rather than randomly trying this out.
I hope you liked the article, please send your feedback and share!